Intelligent Audience Creation
MOBILE ADVERTISING SPECIAL FOCUS
You can’t walk within two feet of a conversation about mobile advertising without hearing the term “big data” being thrown around. Publishers and app developers are gathering more and more data from their users, and the ability to efficiently collect, store and access data at scale to target advertising is becoming one of the most critical elements of the mobile advertising industry.
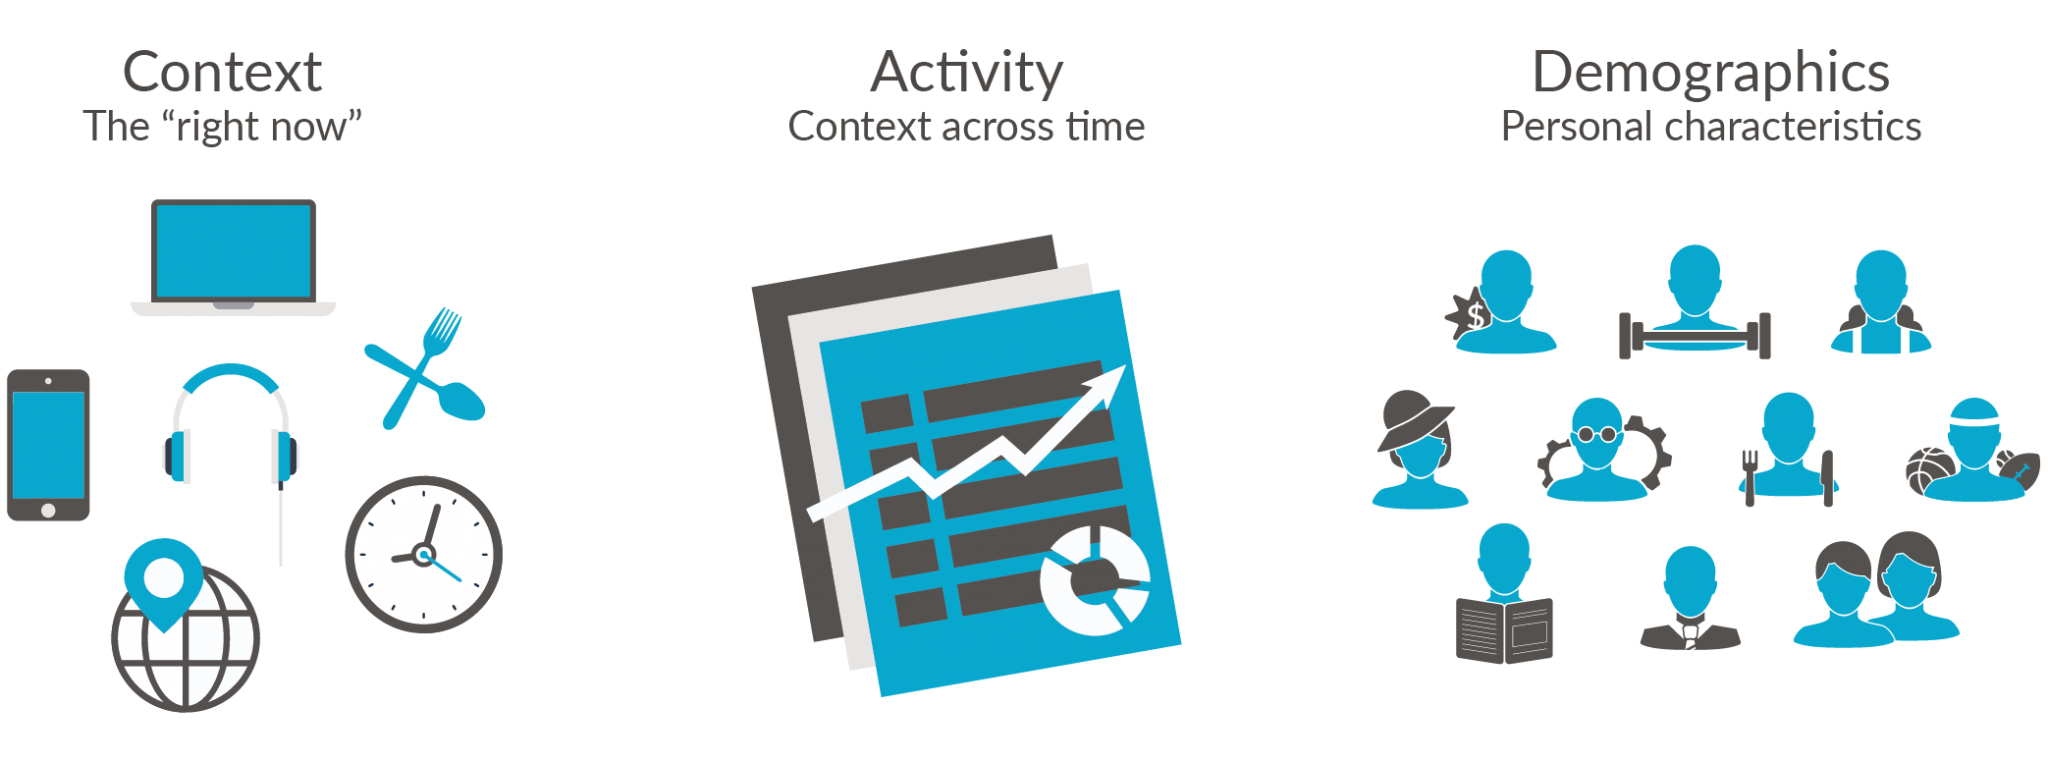
It all starts with collection of raw data from three pillars of information: Context, Activity and Demographics.
1. Unleash contextual information with segmentation
What is your audience doing right now? That is the answer that contextual information provides. Acquired in real-time, it has been the basis of matching advertisements to consumers on the Internet for a number of years. When you see sport-shoe ads on sports sites and movie ads on entertainment sites, that is marketers using contextual targeting. The advertiser assumes that by visiting that site, you are demonstrating interest in sports or entertainment, and therefore you will be interested in products in that same category.
In mobile, some examples of contextual information used for targeting are device type, session depth, time of day, day of week, apps installed (or operating), operator network and network type, as well as the user’s location.
By collecting and combining observations of context into audience segments, we can develop a more complete view of users’ intent and their likelihood of engaging with a particular type of ad. Shown below is a view of several audience segments created by combining device type and country for some of our top global markets.
However, the reality of ad placement is much more complex than optimizing on the context of a particular site, user location or device. There may be hundreds of companies placing ads that target sports sites, iPhones or social app users in London. Which ads are most likely to receive a response from the audience?
To determine an ad’s true relevancy to a user, it requires deeper analysis that takes into account more variables, such as previous user behavior and demographic information.
2. Refine audiences with behavioral insights
How can we accurately observe and understand behavioral activity? We start by capturing data over time from a series of contextual events. For instance, say we know a user has installed apps in the past as a result of a response to an ad. That means they are more likely to do so in the future, so an advertiser will be more inclined to show them a similar type of ad, expecting a response. A user who has not installed an app in the past, on the other hand, might be shown a lower paying “house” ad, since the expectations of that user are lower.
When: Time of day, day of week
Our data shows that users’ engagement with advertising changes significantly over the course of a day, and it also varies by day of week. For example, within the top five markets of Western Europe, user engagement by selected categories over 24 hours shows two primary engagement periods: one in the morning (6-10am), driven by high interest in news, and one later in the day (6-9pm) where we see increased interest in sports, weather and social networking.
In our time-of-day graphic, we can also see that the Games category has a very low variance across the 24 hours. A deeper look at the Games category highlights the impact of the day of the week on audience behavior. The chart here shows impression volume and click-through rates (CTR) for video ads within a popular game application. The green fills show CTR and impression volumes significantly higher than average. The red reflects days where those measures are significantly below average. We now need to identify further attributes about the users in these time-of-day and day-of-week segments.
Need vs. want state
What is the difference between need and want? When a consumer is in “need” state, they require that mobile site or app to fulfill an immediate and often tactical desire, such as searching for a nearby coffee shop or finding the right tool for a home project. “Want” state, however, is when the consumer is most receptive to brand advertising messages.
In this graph, we can see this dichotomy through the comparison of impression volume and click-through rate (CTR) on one of the region’s most popular sports apps. When impression volume is the highest, CTR is at its lowest, which indicates that users “need” their sports information and are thus less receptive to ads. When the user shifts into “want” mode, or a “lean-back” state, CTR increases as they actively engage with brands within that app.
How often: Frequency of use
How often a user accesses a site or app, often measured as “sessions” in a given time period, is another important metric. However, understanding the time period across which the total user base frequents the app is just as important. As shown on the chart, some site categories see their users early in the time cycle, while others have a more gradual
user acquisition cycle. This acquisition cycle is driven by session frequency. In our example, sports sites will see over 50% of their monthly users within the first week of a monthly analysis cycle, with an additional 20% being identified in the next 10 days. In contrast, sites in the food and drink category go much longer before they acquire those respective shares of their total monthly users.
For how long: Time spent
While frequency does indicate interest, and helps us decide which period of time to use for data capture, time spent is a key metric for understanding how deep the user’s interest really runs. Globally, time spent is influenced by a number of factors, such as cost of data plans, the availability and quality of high-speed networks, and the mode of engagement (web vs. app).
In the United States, for instance, mobile apps are popular and data networks are both ubiquitous and reasonably priced. Here we can see how U.S. users, under that set of circumstances, spend their mobile time. (A different set of mobile “norms,” such as those you find in other countries, might influence this category breakdown.)
Where: Analyze interests
Up to this point, the focus has been on information that can be collected and analyzed for the creation of audiences by a single site or mobile application. Cross-site activity can also be used to create audience segments, and it provides a much deeper understanding of a user. While cross-site behavioral advertising opens numerous privacy concerns, today’s data management platforms (DMPs) are focusing efforts in this area to provide useful information to the advertiser while simultaneously protecting consumer privacy.
By collecting and combining observations of context, activity and demographics into audience segments, we can develop a more complete view of users’ intent and their likelihood of engaging with a particular type of ad.
From our analysis we find three general types of users:
Mobile Monogamous. This group, which represents approximately 21% of all users, focuses on one type of site or app, usually in the social or business category, and as such yields little insight from cross-site behaviors.
Multi-dimensional. This group frequents 2-6 categories and comprises approximately 51% of all users. This graphic depicts our three user groups on the left. On the right, you can see a breakdown of the sites visited by users of three different site categories. The sizes of the bubbles are relative to the number of unique users in each group.
Contextually diverse. This group (28% of all users) has a very broad range of interests, visiting seven or more site categories. The chord diagram below shows how one of these segments (users who spend most of their time on education sites) disperses their visits across other site categories. The size of the connecting lines represents the volume of
traffic going to the site categories shown on the
outside of the circle.
As you get more granular in your selection of audience variables, you can expect better results. In fact, the drive for higher eCPMs and fill rates has made data and the ever-increasing demand to collect and analyze it the driving force behind much of the innovation in mobile advertising. However, by increasing your ability to collect and analyze data to create audiences, you will be faced with two dilemmas:
1. The more granular your audience segments, the smaller your resulting audience will be. To be successful, you must balance targeting efficiency with scale potential.
2. As you increase the quantity and variety of the data you collect, along with the audience segments you identify from that data, the more complex the ad delivery environment will be. It is impossible for a person (or even a team of people) to run this kind of “real-time” targeting and optimization. This is where computing power becomes necessary.
Machine learning is a technology that uses historical data to make predictions about new data. With machine learning, analytic models are created using algorithms to identify patterns in historical data, which is called training data. We can then use these analytic models to make predictions about new data as the new data becomes available.
Machine-driven algorithms are far more efficient than humans at simultaneously evaluating the multiple contextual, behavioral or demographic attributes that impact the performance of an ad campaign. Machines can look at multiple attributes simultaneously, while humans are severely limited in their ability to find patterns in data sets of ad traffic. Machine learning is used to create a wide variety of predictive applications. Within mobile advertising, machine learning is often used to build applications for:
Audience clustering
Enhancing request data
Optimizing real-time bid pricing
Dynamically adapting creative
Audience clustering
With the plethora of audience intelligence available, how do you derive a targetable audience segment from such a large quantity of data? Machine-learning algorithms can determine from a broad set of attributes which ones are the most relevant to achieving the campaign objective, thereby creating an audience cluster. We can then establish rules that will automatically assign a new user to a cluster in a way that only users with the highest probability of contributing to the campaign objective receive a particular advertisement.
To illustrate an approach to clustering, we took a group of users that engaged with various ad campaigns and created clusters based on their behavior using specific applications and a set of contextual variables. Armed with these audience clusters, a machine-learning system could assign new users to a cluster in real-time while simultaneously informing the ad delivery system to send the right ad impression to that user based on the cluster assignment.
Enhancing request data
Publishers supply information to buyers about their users, and while often it is sufficient for ad delivery and real-time bidding (RTB) buying decisions, they are often missing some key element for the buyer. For example, relatively few publishers can offer demographic data about their users, but this data is often considered critical for buyers.
This is where DMPs have gained traction in the market; they can enrich the supply-side data to give the demand side a better view of what they are bidding on. That enrichment can come from an external data set, or it can be derived by statistical models. For example, we can infer some unknown attributes, such as gender. A recent analysis of RTB inventory revealed that only 9% of requests came with a gender annotated. In comparison, machine-learning algorithms in test scenarios have provided a confirmed gender for over 66% of users.
Optimizing real-time bid pricing
RTB is a growing part of the mobile advertising ecosystem. With RTB, demand-side platforms (DSPs) must determine their optimal bid for every ad impression, in real-time. Executing in this model requires a data-driven analysis of each impression to predict performance metrics such as click-through rate (CTR), conversion/install rate (CR/IR), and even post-install measures like Lifetime Value (LTV).
Ultimately, the value of machine learning in the RTB environment is empowering advertisers with the tools to treat every user as an audience of one.
Machine-learning models in this environment can determine engagement and performance metrics based on some or all of the audience data types discussed here. Quite often, the most difficult part of creating these models is identifying which data variables to use in the analysis. The graphic below depicts one example of regression modeling used to identify the variables that were significant to higher engagement performance for ad creatives from two different advertising verticals.
Dynamically adapt creative
As we approach the ability to target an audience of one, we must not only deliver the right advertising message to the user, we must also dynamically change the ad creative to be more contextually relevant. This means tweaking elements like colors, images, products and messages in real-time, driven by what will be most relevant to the audience.
As demonstrated below, ad creative can be dynamically optimized on factors like location, language, the weather and time of day. We can also adapt creative to the type of content being viewed in the app or on the mobile site, or we can use past performance of different ad creative design elements to make decisions about what to deliver. Audience clustering and optimization models as described above all come to play in this machine-learning environment.
Measure everything
Along with machine-learning tasks, today’s data management and analysis systems support the vital role of performance measurement. The ability to rapidly adjust campaigns to optimize performance, often in real-time, is critical to marketing success.
But, in order to define the “right” ad for each targeted market segment, we must extensively test the ad creative. Digital marketers should be familiar with A/B testing. In audience creation, A/B testing means selecting two audience models, each with a single variable that is different from the other (A and B) and a metric that defines success (e.g., conversions). To determine which audience model is better, you subject both to experimentation simultaneously. The top-performing version then can be selected for real-world campaign use, or put up against another model for more testing.
As demonstrated by the chart, even simple adjustments can yield big results. In this example, we show the results of test A, where time of day (ToD) was not considered. The test B highlights the lift achieved when the ToD variable was adjusted to reflect that the audience may interact more heavily with advertising at selected time periods.
Today A/B testing is giving way to multivariate testing. Multivariate testing uses the same basic premise of A/B testing, which is comparing the performance of different versions of an ad. However, as its name implies, with multivariate testing, multiple variables are modified at once. Since ad creative is made up of combinations of elements such as background images, headline position and message, the goal of multivariate testing is to determine which combination of those variations performs the best out of all possible combinations.
Mid-campaign adjustment and testing
Machine-learning models can lose efficiency over time as consumer behavior and contextual variables change. Regular sampling of prediction records to analyze and audit against targets (true answers) helps guide the refinement of the machine-learning model. If the quality of predictions begins to decline because the original data no longer matches real-world experience, you must come up with a new model or new training data. Even after the campaign starts, advertisers can continue to fine-tune their audience modeling to maximize performance. This kind of “tweaking” yields stronger results than a static approach. Note, however, that as exemplified below, different audience attributes will have different impact on campaigns’ performance, depending on the parameters of that audience or campaign. So, measure everything – all the time – and adjust accordingly.
Audience creation relies 100% on data collection – but media publishers, advertisers and third-party service providers like Opera Mediaworks cannot alienate consumers with unannounced or hidden data collection, usage or security policies.
At Opera Mediaworks, we embrace privacy as a key responsibility to our industry, our customers and ultimately to our friends, families and our fellow employees. After all, we are all members of an audience as well.
To meet our responsibilities to the consumer, we stand behind every consumer’s right to:
An easy-to-understand privacy policy, available wherever they go on the mobile web
Choice regarding the collection, use and sharing of personal information
Reasonable access to a real person they can contact with questions or concerns about privacy policies and practices, as well as access to any personal information about them, and the ability to correct, amend or delete information that is demonstrated to be inaccurate or incomplete
Confidence that their data is secure from loss, misuse and unauthorized access, disclosure, alteration and destruction
As we leave this section on machine learning, it is important to note that while much of our discussion focused on classification and regression analysis, most of the time, the actual ad delivery system is binary. Therefore, analysis and modeling is only an enabler of what must be the real-time response to a simple question: will this user convert, yes or no?
