The State of Mobile Advertising, Q2 2013

To start, we’d like to note the tremendous growth within the mobile ad market in the one year since we first began publishing the State of Mobile Advertising report. In Q2 2012, the Opera Mediaworks platform supported 9,000 sites and applications with some 35 billion mobile ad impressions per month. Today, we serve over 13,000 sites and apps, with well over 60 billion impressions per month
In 2011, we facilitated $240 million in revenue, which leapt to $400 million in 2012. So far in 2013, we are on track to deliver over $600 million in revenue to mobile publishers and application developers – a significant figure that solidifies this platform as a major player in the mobile ad space.
In this edition of the report, we continue to share data around global mobile ad traffic and monetization by device, geography and publisher category – with some additional insights into trends in these areas that have emerged in the past year. We will also report on:
- The Apple vs. Samsung battle, as seen from mobile ad traffic
- Seasonality in the American market
- Mobile ad benchmarks and most effective ad types
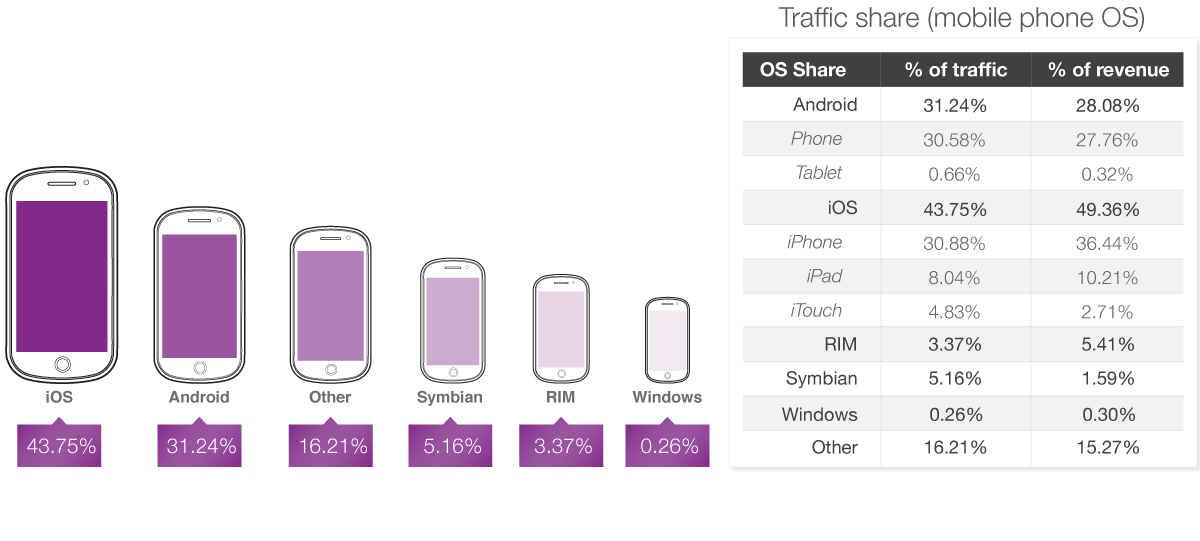
iOS continues as the top OS in monetization and regains lead in mobile phone impression volume
Overall, iOS is the clear market leader in both impression volume and revenue generation, capturing nearly 44% of all ad impressions and almost half of all revenue.
However, when comparing mobile phones using iOS and Android the two OS are in a virtual tie for share of ad impressions, with just over 30% each. Late last year, Android inched ahead of iPhone with a slight lead (31% vs. 29%), but iPhone has been inching back and, within one percentage point ever since.
The iPhone still triumphs in terms of monetization, however, with 36.4% of revenue vs. Android’s 27.8%. And while in Q1 Android tablets began appearing in our data set, their market share is still almost imperceptible. Traffic share (mobile phone OS)
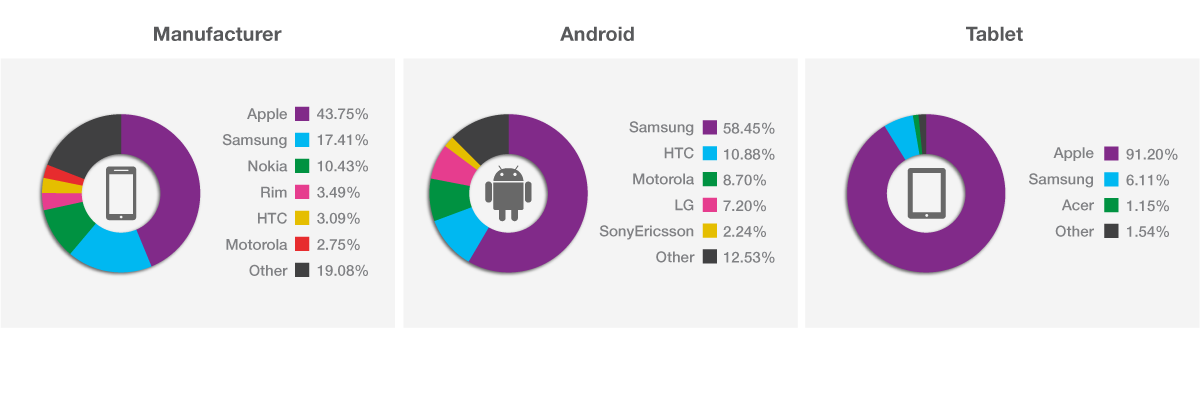
Samsung nipping on Apple’s heels for device market share
Apple is still the top manufacturer of mobile devices, with 43.8% of all impressions served on its devices. Samsung is the strongest contender from the rest of the pack, with a 17.4% share. Among tablets, Apple captures the lion’s share (91.2%) with Samsung following at 6.1%.
However, when segmenting the view to focus solely on Android device manufacturers, Samsung emerges as the clear leader, with 58.5% of impressions going to Samsung devices. HTC, Motorola and LG fall far behind, all in the 7-11% range.
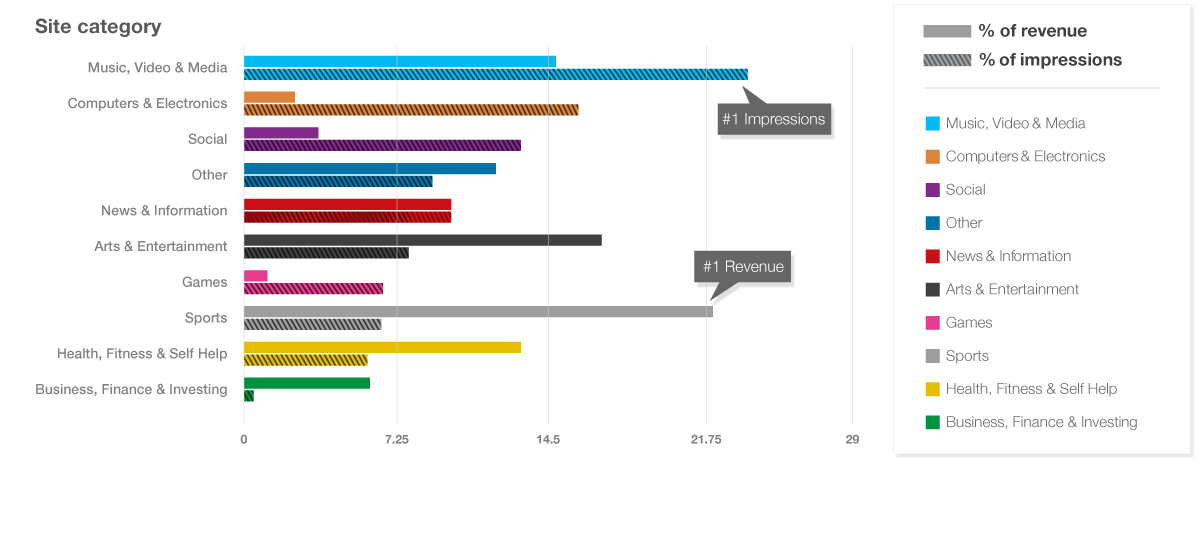
Baseball season pushes Sports to the No. 1 category for publisher revenue
As we’ve seen from previous quarters, mobile sites and apps in the Music, Video & Media category consis- tently receive the most ad impressions, and those in the Business, Finance & Investing category produce the highest revenue per impression. However, in terms of total revenue generation this quarter, Music, Video & Media loses its No. 1 spot and falls to third place, behind Arts & Entertainment. The Sports category vaulted to the top as a direct result of the opening of Major League Baseball season.
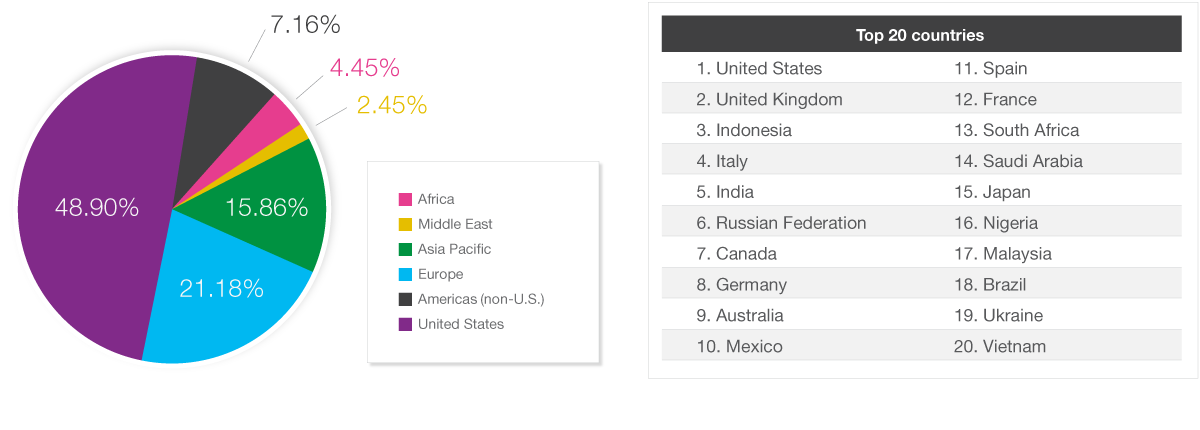
Ad requests and impression volume continue to grow worldwide
The United States drives the majority of ad requests and revenue on the Opera Mediaworks platform, but it is seeing a slight drop in global market share. In Q1 2013, the U.S. share of requests was 50.67%, while this quarter it represents 49.3% of the market.
The United States is still the biggest market in terms of revenue, with nearly 3 out of every 4 dollars in transactions taking place in the U.S. market. And, overall, the total volume of mobile ad requests and impressions in the United States is increasing.
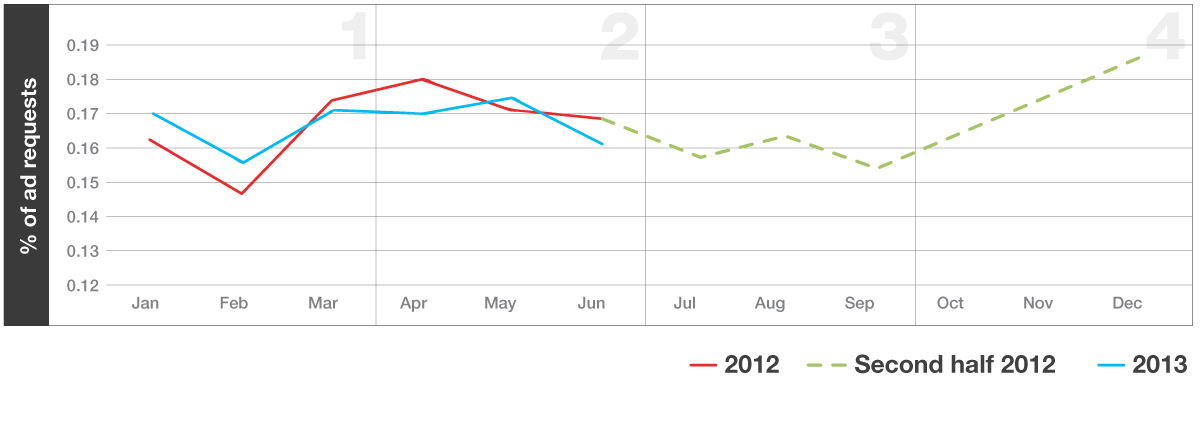
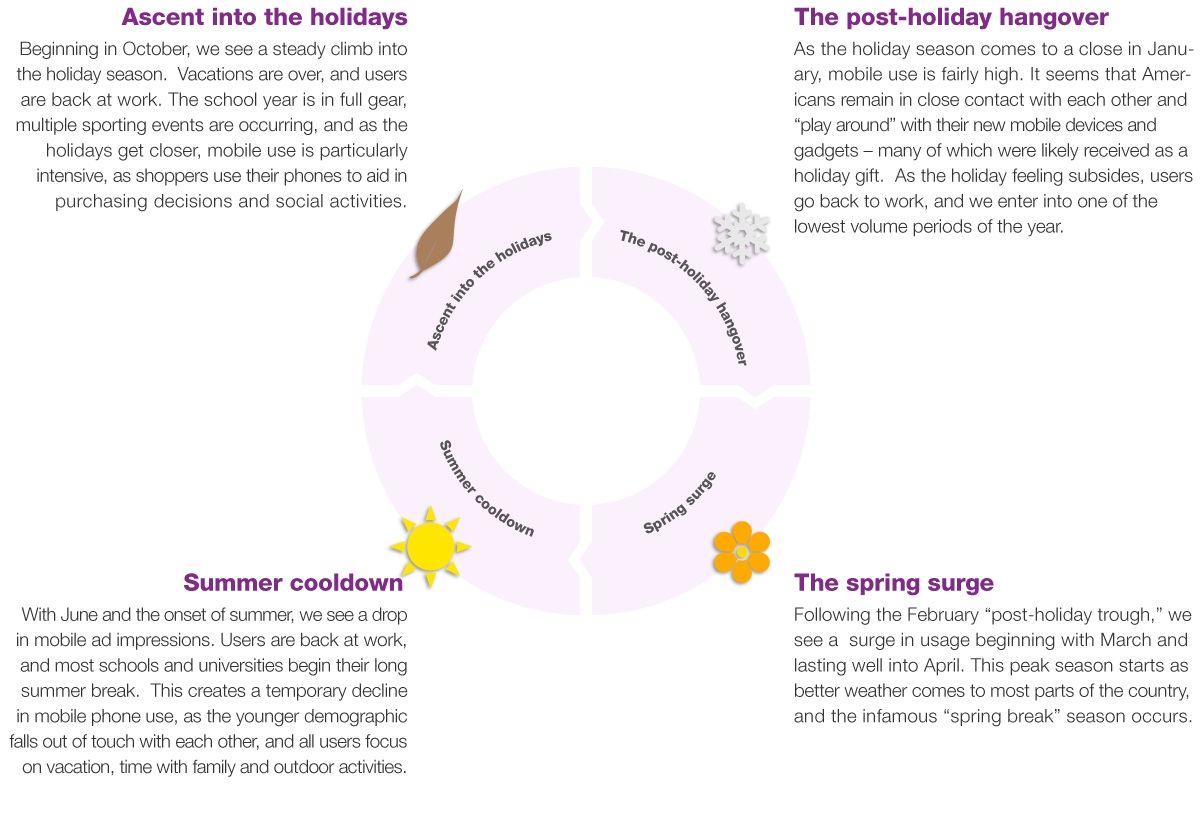
US consumers demonstrate clear seasonal use patterns
We can see the effects of seasonality when a time series of data points such as traffic or revenue exhibit cyclical variation. The most common example of seasonality is how retail sales peak during the holiday season and quickly fall off in January.
When comparing monthly ad impressions from first half of 2013 to those from 2012, we can see a clear cyclical variation that shows how mobile phone use varies throughout the first half of the year.
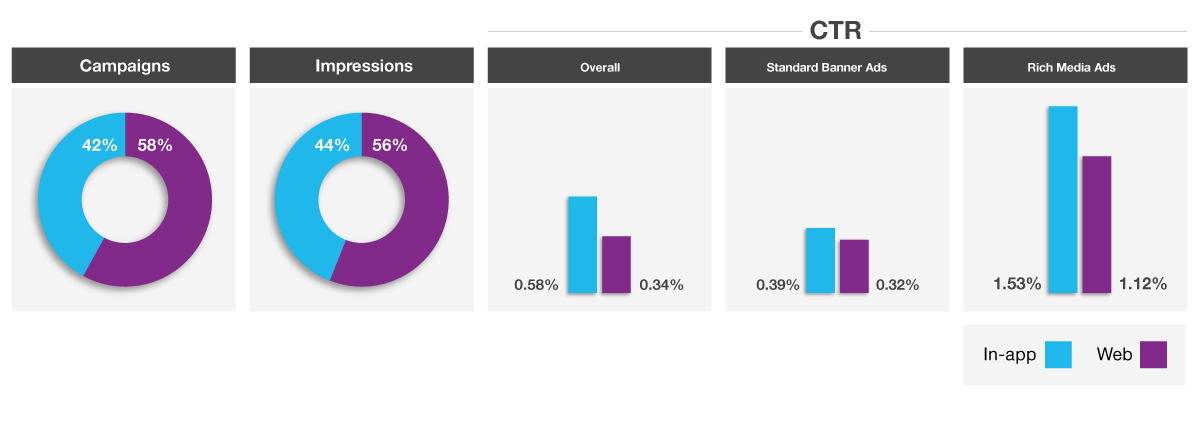
Rich media, in-app campaigns outperform banner, mobile web
Rich media ads are becoming a more popular choice for advertisers, but do they really work better? We took a closer look at 378 mobile ad campaigns running in the United States during the month of May, each with over one million impressions. We found that, on average, rich media campaigns performed far better than standard banner ads, sometimes as much as 400%.
Breaking it down a bit further, we saw that rich media ads served within mobile applications were more compelling than those served on the mobile web. Users clicked on in-app ads 1.53% of the time, vs. 1.12% for mobile web ads. Standard banner ads, by comparison, average a 0.39% click-through rate when served in-app and 0.32% when displayed on a mobile website.
Taken together, we see that overall in-app ads perform 1.7X better than mobile web, but they are still the minority. The number of ad campaigns and impressions on the mobile web vs. in-app is nearly a 3:2 ratio.
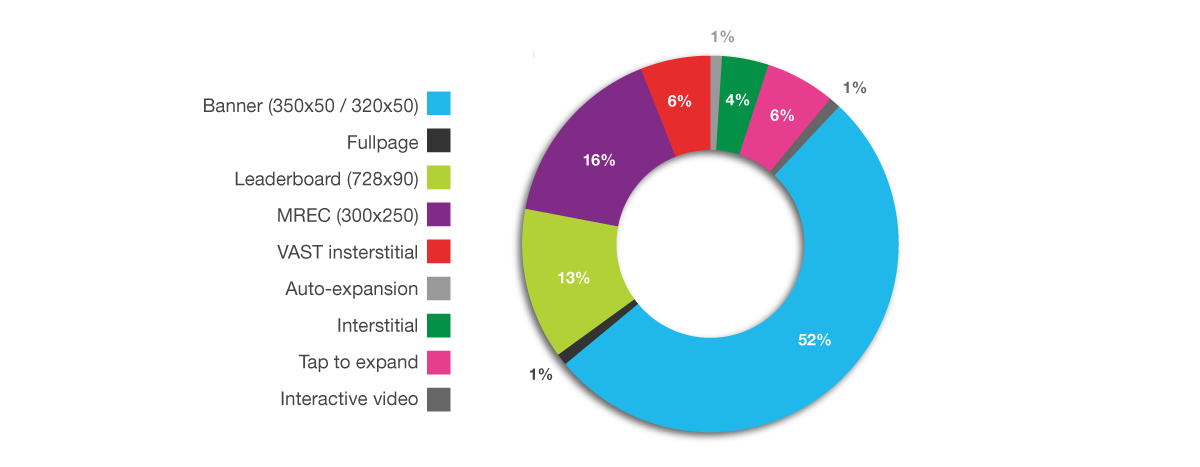
Advertisers dive into rich media with tap-to-expand and mobile video ad units
Currently, standard banner ads (300×50 and 320-50) make up more than half of the campaigns on the platform, followed by leaderboards (728×90) and MREC (300×250).
In the past quarter, we’ve seen advertisers begin to adopt relatively new but highly effective ad types such as tap-to-expand and VAST interstitial (mobile video) units.
These two types in particular are favorites of premi- um brand advertisers who are looking to share unique content and deepen engagement with consumers rather than “light touch” metrics such as brand aware- ness or low-end conversions.
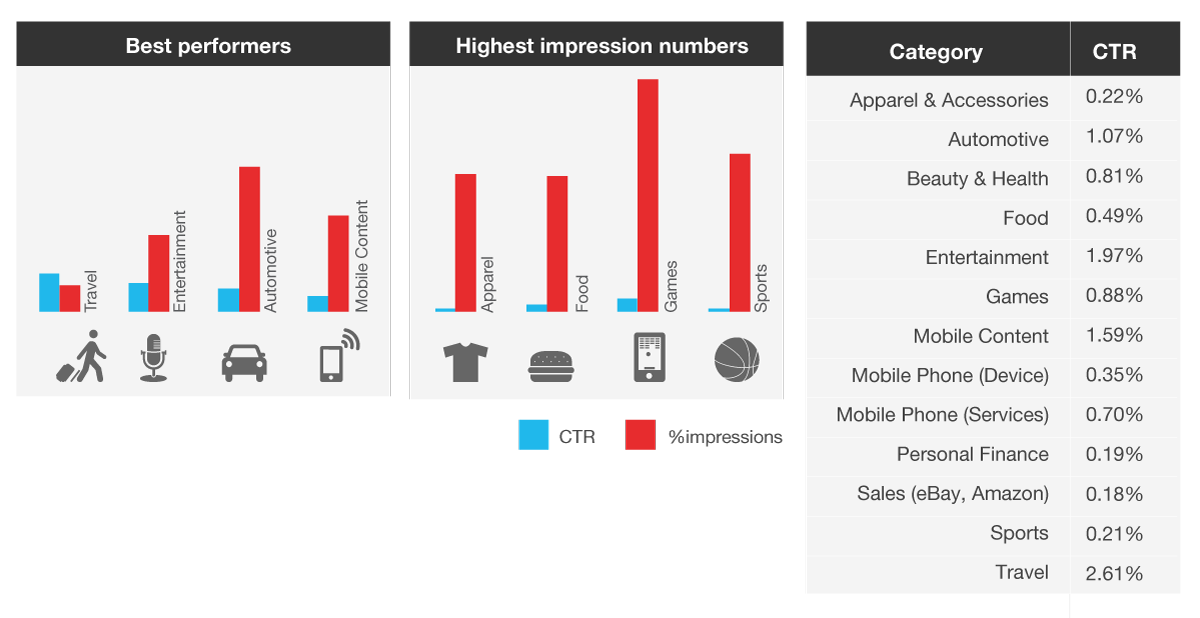
Travel is top performing category, followed by Entertainment and Mobile Content
To better understand not only what types of campaigns (e.g., rich media, in-app) are performing the best in mobile, but also which types of advertisers are seeing great results, we took a smaller sampling of campaigns from the platform and dug into their performance.
We found that the best performing ads — those which achieve click-through rates well above 1% — are in the Automotive, Entertainment, Mobile Content and Travel categories. Unsurprisingly, all of the top campaigns in these categories were rich media, though just half of them were in-app vs. mobile web.
Advertisers promoting products or services in the Apparel, Food, Games and Sports categories had some of the highest impression volume and number of campaigns, but their best cilck-through rates were significantly lower.